Google has started for a long time to hide Android distribution data that has been used by competitors for years to attack the popular mobile OS. The fragmentation of Android on the market is a reason for constant jokes for Google. Both customers and competitors are eager to use this to emphasize the disadvantage of Android in this field.
Over the years, Google has constantly updated the data of versions distribution. Although it was mainly a tool for programmers, access to this information was available to everyone. The fundamental idea behind these numbers is to inform developers which audience they will reach by choosing a given version of the OS.
Unfortunately, with each subsequent version, there was a growing problem that Android couldn’t cope with. The new versions grew incredibly slowly, and there are huge portions associated with the old, outdated versions that did not want to decrease.
This is the new Android distribution data: fragmentation is still real
From October 2018 something started to happen, before this date, Google updated data on the use of distribution in monthly intervals. This changed on October 26, 2018 because from that moment for almost half a year Google stopped showing how Android handles the problem of fragmentation.
We had to wait for the next update until I/O 2019. It was only there that the data on the share of individual Android distributions came to light. And what does it look like? The problem is still persisting.
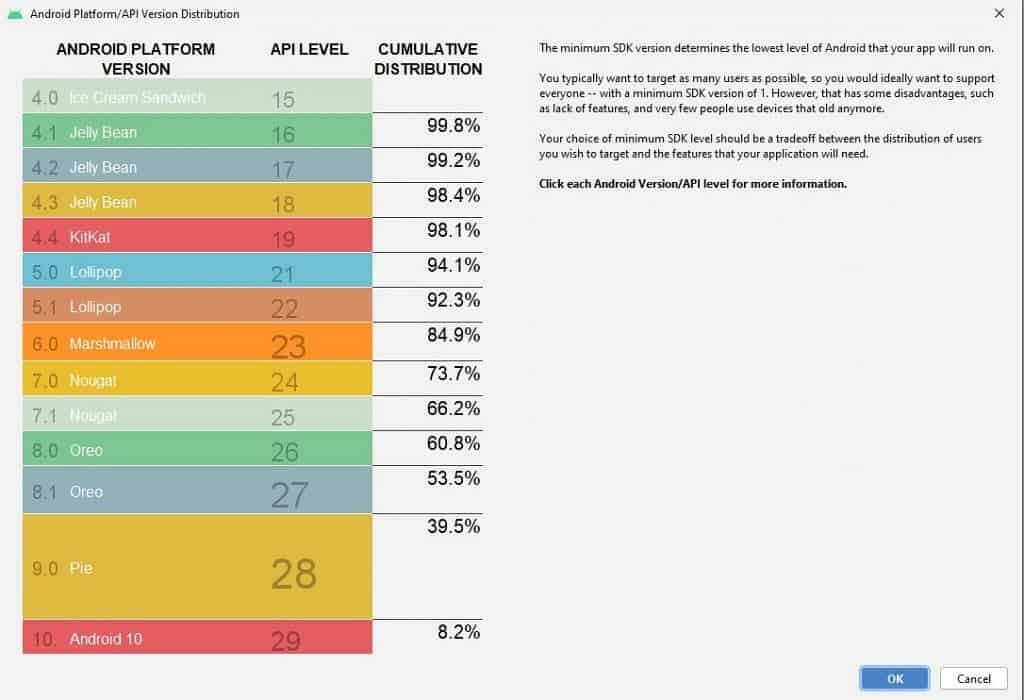
Now, fortunately, the data is not a secret anymore. Google can’t afford it. After all, programmers need to know what market share a given version has to properly design their applications. Access to them is relatively simple but requires willingness. You must download Android Studio, the development environment for creating Android applications, and create a new project. There, when choosing a version, we get accurate information about the portion of each individual version of Android.

Here is a simplified list, by focusing on the annual versions:
- 4.0 “Ice Cream Sandwich”0.2%
- 4.1 – 4.2 – 4.3 “Jelly Bean”1.7%
- 4.4 “KitKat”4%
- 5 “Lollipop”9.2%
- 6 “Marshmallow”11.2%
- 7 “Nougat”12.9%
- 8 “Oreo”21.3%
- 9 “Pie”31.3%
- 10 8.2%
We are already talking about Android 11 and what new, fantastic functionalities will be introduced in it, and yet the latest version (Android 10) has not exceeded 10% market share.
So what’s the point of getting a new number every year. Only a small fraction of customers can benefit from the latest version. There are also producers who are very slow on updating. Google has a hard work to do to resolve this problem.


